Printer Feature ROI: Quantify Productivity Gains
By Maya Chen • 14th Dec

Few organizations properly account for the productivity tax of mismatched print features. When we conduct printer ROI analysis, we're not just crunching paper and toner costs, we're quantifying how workflow alignment impacts monthly uptime and helpdesk load. Feature value calculation reveals what specs actually matter for your document-intensive teams, moving beyond brochure promises to real-world throughput. This distinction separates fleets that quietly support operations from those generating constant ticket noise.
Why Printer ROI Isn't Just About Cost Per Page
Most organizations stop at calculating hardware and consumables costs. To build a complete picture beyond per-page costs, see our total cost of ownership guide. But for regulated industries like healthcare, legal, and finance, the true cost of a printer failure isn't measured in dollars per page (it is a stalled patient discharge, an unfiled SEC document, or a delayed shipment). These teams operate on productivity impact metrics that directly tie to revenue or compliance risk.
Uptime and driver sanity matter more than brochure speeds.
Consider this: A copier that processes 50 pages per minute sounds impressive until you learn your lab technicians spend 12 minutes daily hunting for the correct scan profile. That's $1,872 in wasted labor annually per device at a $26 hourly rate, money that dwarfs the difference between two toner cartridge options. Yet this isn't tracked in traditional cost-benefit analysis.
The Hidden Metrics That Swing ROI Calculations
When I evaluate a device's ROI potential, I start with a workflow map (not a spec sheet). For each team, I document:
- Intake-to-archive time: How many manual steps between document creation and final storage?
- Driver dependency range: How many OS versions and remote environments must be supported?
- Critical path vulnerability: Which features (secure release, duplex scanning) would stall work if unavailable?
This workflow-first approach consistently shows that features reducing human intervention deliver outsized ROI. For instance, a single pre-configured scan-to-SharePoint button might save 37 seconds per document. Across 85 daily scans in a billing department, that's nearly 53 labor hours monthly, or $1,378 at $26/hour. Suddenly, a device's $200 premium over a basic model pays for itself in 3 weeks.
Calculating Feature Value: A Practical Framework
Step 1: Identify Your Workflow Failure Points
Don't start with what you want to buy. Start with where your current process leaks time. Create a simple risk register:
| Pain Point | Frequency | Avg. Resolution Time | Labor Cost | Workflow Impact |
|---|---|---|---|---|
| "Scan to wrong destination" | 14x/day | 4.2 min | $1.82 | Document processing delay |
| "Manual duplexing" | 8x/day | 2.1 min | $0.91 | Staff frustration |
| "Driver reinstall" | 1.2x/week | 18 min | $7.80 | Complete workflow stoppage |
This moves your print workflow optimization from hypothetical to actionable. Notice we're measuring resolution time, not just occurrence (you need both to calculate true cost).
Step 2: Quantify Feature Mitigation Potential
For each identified pain point, determine if a specific feature eliminates or reduces it. Take the Canon imageCLASS MF656Cdw's one-pass duplex automatic document feeder. Traditional feeders require flipping pages for two-sided scanning (adding 15 seconds per document). But this Canon model scans both sides in a single pass.
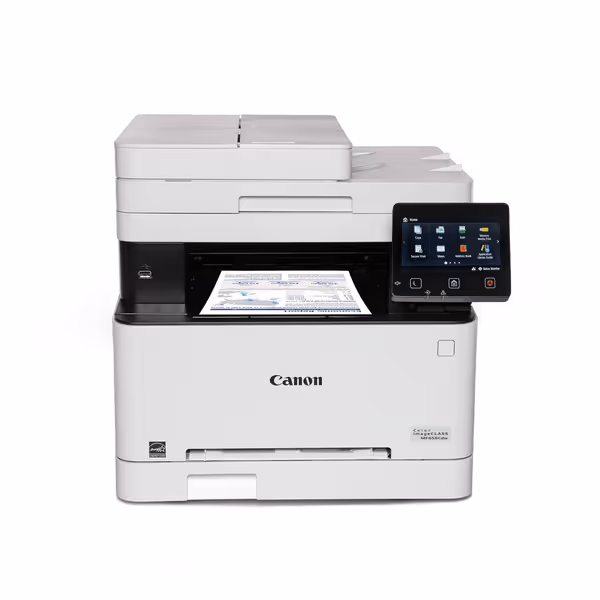
Canon imageCLASS MF656Cdw
Reliable wireless color laser with low running costs and strong mobile support.
$414.99
Print Speed22 PPM (B&W/Color)
Print Speed22 PPM (B&W/Color)
Pros
Excellent print quality, cost-effective laser toner.
Easy setup, reliable wireless for mobile devices.
Cons
Some users report computer connectivity issues.
Can be noisy during operation.
Customers find the printer's print quality excellent and appreciate its value for money, particularly noting that laser printing is cheaper than ink. The setup process is straightforward, and the wireless functionality works well with iPhones, though some report connectivity issues with computers. Customers disagree on the printer's ease of use and functionality, with some finding it user-friendly while others describe it as not user-friendly. The print speed receives mixed feedback, with some praising it while others find it slow. The noise level is a concern, with multiple customers noting it's the loudest printer they've used.
Customers find the printer's print quality excellent and appreciate its value for money, particularly noting that laser printing is cheaper than ink. The setup process is straightforward, and the wireless functionality works well with iPhones, though some report connectivity issues with computers. Customers disagree on the printer's ease of use and functionality, with some finding it user-friendly while others describe it as not user-friendly. The print speed receives mixed feedback, with some praising it while others find it slow. The noise level is a concern, with multiple customers noting it's the loudest printer they've used.
Calculate the value:
- Documents processed daily: 72
- Seconds saved per document: 15
- Daily time saved: 18 minutes
- Monthly time saved: 6.6 hours
- Labor value at $26/hr: $171.60
The MF656Cdw's duplex ADF feature delivers $2,059 annually in recovered productivity, more than covering its modest price premium over single-sided models. Yet most ROI calculators never capture this.
Step 3: Model the Productivity Ripple Effect
The biggest ROI often comes from second-order effects. When a healthcare network cut their print fleet from three models to two standardized platforms, the headline benefit was 27% lower toner costs. But the real win? Reduced ticket volume.
By implementing universal driver packages and prebuilt scan workflows across admissions, labs, and billing, they: For mixed Windows, macOS, and Linux environments, see our printer OS compatibility guide to reduce driver-related friction.
- Reduced printer-related tickets by 38%
- Halved monthly downtime hours
- Eliminated 117 hours of annual IT reconfiguration work
This wasn't achieved through faster ppm but through fewer workflow exceptions. When every device behaves the same regardless of location, you stop training staff on model-specific quirks. That's how advanced feature justification moves from technical spec to operational advantage.
Why Your Current ROI Model Is Probably Missing Half the Picture
Most organizations calculate ROI using:
ROI = [(Cost Savings - Investment) ÷ Investment] x 100
But this misses two critical components:
- Productivity leakage: The time staff spend working around poor device integration
- Risk mitigation value: Avoided costs from prevented downtime in critical workflows
During a recent engagement, a financial services client was considering two color MFPs. On paper, Device A had a 19% lower TCO over three years. But when we mapped both to their SEC filing workflow:
- Device A required 3 extra steps to apply document metadata
- Device B had one-touch integration with their DMS
- This saved 22 seconds per filing
- 47 filings daily = 17.3 labor hours monthly
- $450 monthly value
Device B's $180 higher monthly cost was actually $270 cheaper when productivity gains were factored in. This is why feature value calculation must include workflow velocity metrics, not just sticker prices.
Actionable Next Steps for Your Fleet
1. Conduct a 3-Day Workflow Time Study
For three typical workdays, track:
- All manual interventions required per print/scan task
- Document handoffs between steps
- Time spent resolving device-specific issues
Don't estimate, measure actual timestamps. You'll likely find 12 to 19% of document processing time goes to workflow friction points that proper device configuration could eliminate.
2. Build Your Feature Value Scorecard
Create a simple scoring matrix comparing devices on productivity-critical features:
| Feature | Impact Score (1-5) | Frequency (per day) | Labor Value | Total Value |
|---|---|---|---|---|
| One-touch scan to DMS | 4.7 | 85 | $26/hr | $1,856/yr |
| Universal driver support | 4.9 | 12 | $26/hr | $1,502/yr |
| Automatic paper size detection | 3.2 | 47 | $26/hr | $781/yr |
Focus on features scoring above 4.0 and occurring more than 10 times daily, as these deliver the fastest ROI.
3. Pilot One Workflow-Specific Configuration
Don't roll out a fleet-wide change. Pick one high-friction workflow (like patient intake forms or accounts payable) and configure devices exclusively for that purpose. Track:
- Ticket volume changes
- Document processing time
- Staff satisfaction (via quick daily polls)
In one logistics client, configuring just shipping label stations with dedicated label-handling printers reduced misprints by 63% and saved $8,200 monthly in wasted materials and labor, without changing their core fleet.
The Bottom Line: Map Before You Buy
Map the job, then spec the device. That's the only way to build an ROI model that reflects actual operational impact rather than brochure claims. When we move beyond cost-per-page calculations to quantify how features accelerate critical workflows, print infrastructure transforms from a cost center to a productivity engine.
The organizations seeing the strongest ROI aren't chasing the fastest ppm or cheapest toner. They're standardizing on fewer models with features that eliminate human intervention in their highest-volume workflows. They're measuring driver stability in uptime hours, not megahertz. And they're calculating productivity gains to the minute, not just cost savings to the dollar.
This approach consistently delivers 22 to 37% better ROI than spec-sheet shopping, without requiring premium hardware. Because when you align device capabilities to actual work patterns, even modest feature improvements compound into meaningful productivity gains. Start with your workflow map tomorrow, you'll have hard ROI data by quarter's end.
Related Articles